BY: Tom Stringfellow, CFA®, CPA®, CFP®
Chief Investment Strategist
Walking The Line
As expected, the Federal Reserve held interest rates steady last week and signaled it still plans multiple cuts before the end of the year. Following its two-day meeting, the Federal Open Market Committee (FOMC) kept the benchmark overnight borrowing rate at 5.25% to 5.5% as of July 23 of last year. In a subsequent press conference, Fed Chair Jerome Powell reassured the market that while disinflation had slowed, the Fed still expects to cut interest rates three more times by year’s end.
The Fed Blinks
Heading into last week, significant investor uncertainty existed over the FOMC’s policy direction. Any expectations for the first rate cut had already faded, given the number of Fed voting members talking down the near-term prospect of any easing until at least June. Fortunately, the market was prepared for some pushback on near-term rate cuts. Most surprising for investors, however, was the Fed’s upgraded growth outlook and its expectations for three rate cuts this year still in the cards—even as the Fed raised its core inflation expectations for this year from 2.4% to 2.6% along with an expected risk in GDP growth in 2024 to the upside. The March Fed meeting proved to be a market catalyst, with the prospect of a soft landing in 2024 almost baked into the Fed’s forecast.
The economic data later in the week revealed a few mixed reactions as the weekly jobless data remained supportive of the Fed’s economic outlook and a number of manufacturing and consumer reports suggested some improvement ahead. Among the earliest of those reports, durable goods orders posted an increase in orders for the first time in three months. This report was followed by a surprising uptick in both housing permits and starts. Finally, the S&P Global US Manufacturing PMI posted an uptick to a 21-month high of 52.5 in March 2024, beating market forecasts while pointing to improvements in the health of the manufacturing sector, including expansions in output and employment.
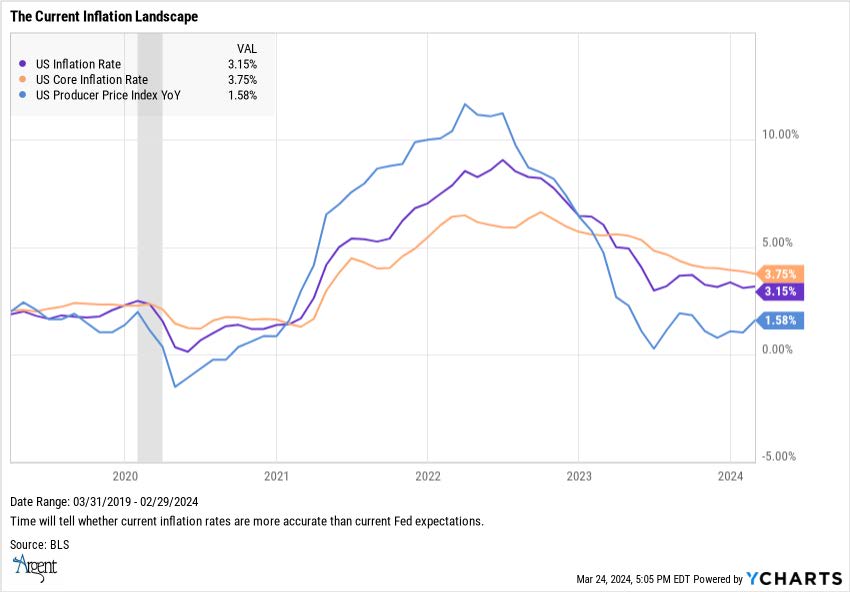
In terms of the ongoing risk of inflationary pressures, inflation growth rates continue to decline, according to key measures such as the Consumer Price Index-CPI and Core CPI-ex food and fuel. The rate of decline, however, has slowed meaningfully. February’s annualized Core CPI report came in a bit hotter than the prior month (3.8% versus 3.7%), but it was still below the January reading of 3.9%. Meanwhile, February’s CPI reading of 3.2% wasn’t hot enough to change forecasts for a June rate cut and, consequently, remained a catalyst for the equity markets. However, a continuing decline in the Core inflation rate will be required to drive the markets from here. A reading closer to the low-to-mid 3% mark would ward off FOMC fears that inflation is on the rebound, forcing renewed policy tightening (another rate hike) and definitely a market negative.
Labor Market Stability
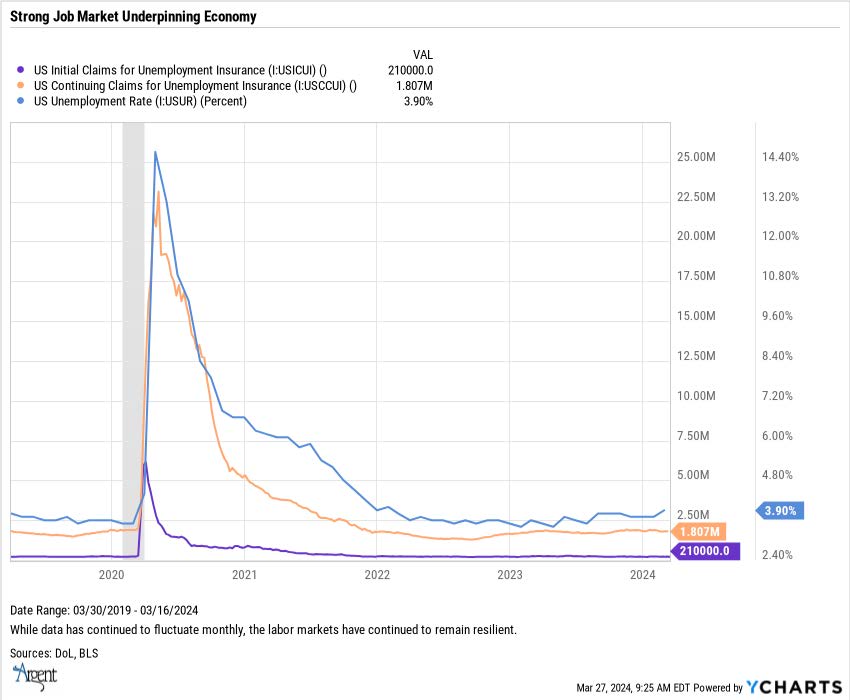
Today’s unemployment rate of 3.9% remains near historic lows compared to the past two decades. However, the level of unemployment did tick upward last month from the prior three-month timeframe rate of 3.7%. Even so, current levels are not far from the two-decade low of 3.4% unemployment reported in April 2023.
A look at where the labor markets are trending: Total nonfarm payroll employment rose by 275,000 in February, above the average monthly gain of 230,000 over the prior 12 months. Average hourly earnings increased by 0.1% in February and 4.3% over the prior 12 months. And the current level of 209,000 initial jobless claims is slightly above the four-week average of 208,000. Continuing claims rose slightly, however, to 1.8 million. There is an obvious dichotomy within these data points: Although low levels of initial jobless claims still point to a tight labor market, continuing jobless claims data helps explain the uptick in unemployment rates.
Even so, the most recent data continues to point to levels of rather broad hiring across a number of industries. Examples include:
- Health care added 67,000 jobs in February, above the average monthly gain of 58,000 over the prior 12 months.
- Government employment rose by 52,000 in February, about the same as the prior 12-month average gain (+53,000). Employment continued to trend up last month in local government (+26,000) and federal government (+9,000).
- Employment in food services and drinking establishments increased by 42,000 in February after changing little over the prior three months.
- Social assistance added 24,000 jobs in February, about the same as the prior 12-month average gain of 23,000.
- Employment in transportation and warehousing increased by 20,000 in February. Unfortunately, employment in the transportation and warehousing industry is down by 144,000 since reaching a peak in July 2022. This trend is likely a function of a step-up in temporary hiring due to post-pandemic “surge” shopping and the untangling efforts of the supply chain breakdown.
- Employment continued to trend up in construction (+23,000), in line with the average monthly gain of 18,000 over the prior 12 months. In February, heavy and civil engineering construction added 13,000 jobs.
- Retail trade employment changed little in February (+19,000) and has shown little net change over the year.
Housing Market Pivot
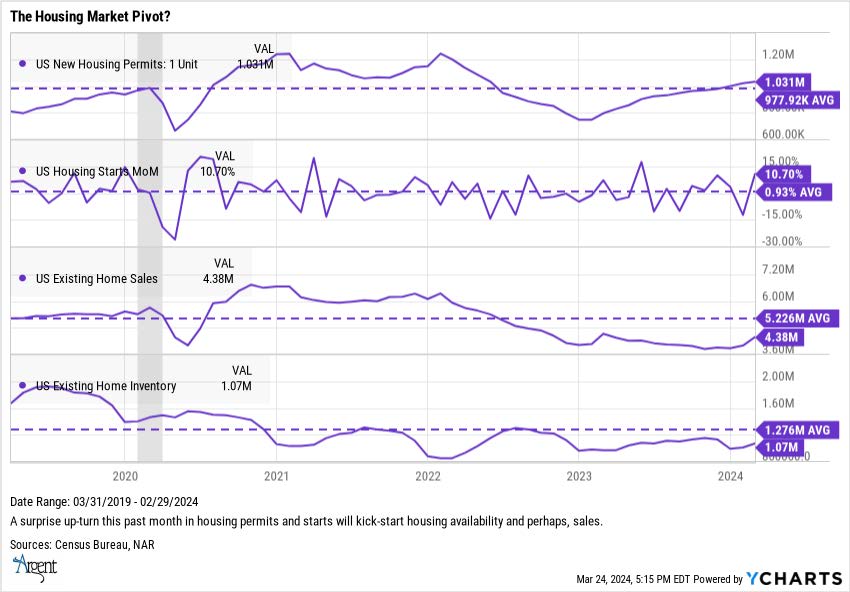
February’s housing data has been a welcome relief to the homebuilding industry. Building permits, housing starts and homebuilder sentiment data all reported better-than-expected results. Housing starts rose by 10.7% on a month-over-month basis, following an upward revision to January’s data, and were also up 5.9% for the year. Positive news for future homeowners: single-family homes led the gains, with housing starting up 11.6% over the prior month and 35.2% over the last year. This is the first time since early 2022 that 12-month housing starts turned positive—a trend that usually does not precede the beginning of a recession.
Other housing barometer readings provided a bit of light at the end of the industry’s long tunnel.
- Permits for new single-family housing construction were up nearly 30% year over year. The West and Midwest regions drove the highest permitting.
- Existing home sales, comprising most of the housing market transactions, rose by 9.5% from the prior month to a seasonally adjusted rate of 4.38 million units—the second straight month of rising sales and the largest increase over the past 12 months.
- According to Realtor.com, 14.8% more homes were actively for sale in February compared to the same time in 2023, marking the fourth consecutive month of annual inventory growth. For the first two months of this year, the inventory of homes actively for sale was at its highest level since 2020. Unfortunately, even with improved numbers, existing housing inventory is still down 39.6% compared to 2017-2019 levels.
- Although mortgage rates remain elevated (approximately 6.87%), builder confidence has jumped to its highest level since July, 2023. Expectations that the Federal Reserve will cut rates later this year should lead to an acceleration in home sales over the coming months.
Scaling The Market’s Wall Of Worry
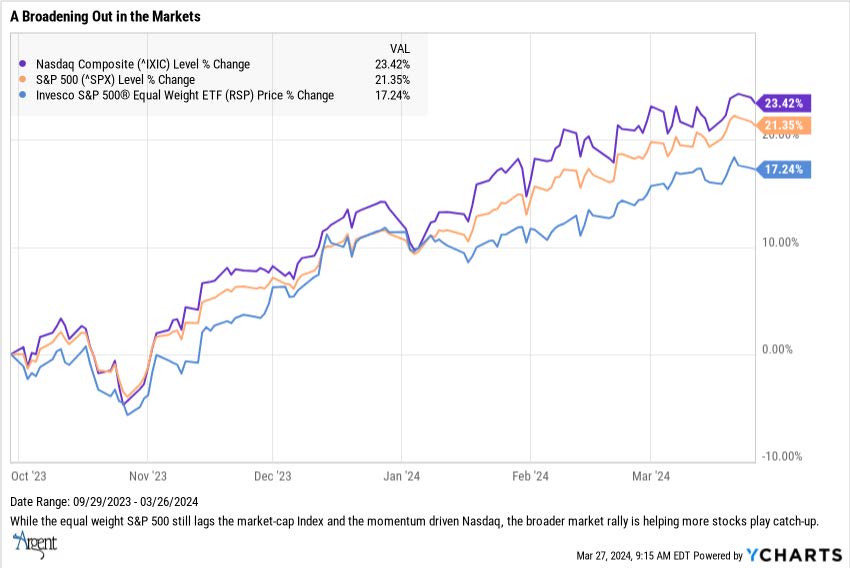
Last year’s market rally was driven by the technology sector’s Magnificent Seven, with momentum technology stocks (think Nvidia) significantly outperforming the rest of the market. Since the first of October last year, the market has become somewhat more balanced as a number of laggard company stocks caught up with the narrower pack.
At the beginning of last year’s fourth quarter, the equal-weight S&P 500 ETF (RSP) began to catch up with both the momentum-driven Nasdaq and the market-cap weighted S&P 500. Technology has retained its first place with a 31% return, but from October 1, 2023, through March 26, 2024, the industrial and financial sector ETFs have both bounced back by 23% and 25%, respectively.
These other sector recoveries are certainly a positive market signal, and we expect the broader market to also benefit from falling inflation and the accelerating growth of AI-driven technology. In the backdrop of this growth-centric optimism is the likelihood that the market (and economy) has had the momentum to withstand the rate-tightening policies of the Federal Reserve. That may not last forever, though. If some growth factors begin showing momentum loss and policymakers aren’t quick enough to cut rates, the chances of a hard landing become more meaningful. Until there is some measurable decrease in earnings or economic data coupled with still restrictive rates, the markets remain “cautiously optimistic.”
In this context, the equity market rally to new record highs was in the backdrop of the FOMC’s continuing expectation for three rate cuts this year while also upgrading its outlook for domestic growth. The upturn in inflation expectations was largely dismissed, however, because as long as economic growth holds up, “slightly stickier” high inflation is more likely to be tolerated. And for now, higher rates and higher inflation are being sidestepped by investor sentiment—again, as long as growth trends continue.
Looking toward the next few months, here are the considerations that should bring market expectations throughout the balance of this year.
- To that point, the bullish outlook for 2024 is still intact, given four expectations: three rate cuts later this year, continued disinflation, economic and earning growth, and the more recent growing artificial intelligence (AI) optimism.
- An incumbent president is on the ballot. According to Morgan Stanley, every year since 1944, an incumbent U.S. president has run for reelection, and stocks posted gains for the year—whether or not the incumbent won. The average one-year return for U.S. equities in those years was 16% in every one of the 13 instances in which a president was seeking reelection.
- Inflation is cooling. As we analyze upcoming year-over-year inflation growth rates, the annual consumer price index (CPI) should continue trending downward compared to the prior year. If inflation remains sticky, however, in certain segments of the economy, this comparative advantage may disappear.
- Market breadth is improving. Last year, on October 27, 24% of the S&P 500 stocks were sitting at their 200-day moving average (an indication of market breadth). By February 12 this year, the percentage of stocks over their 200-day moving average had increased to 66%, and by today (March 27), that level had increased to 79%. This trend indicates that investors were shopping across a broader universe of stocks, visible in the the past few months’ uptick in the equal-weighted S&P 500 ETF.
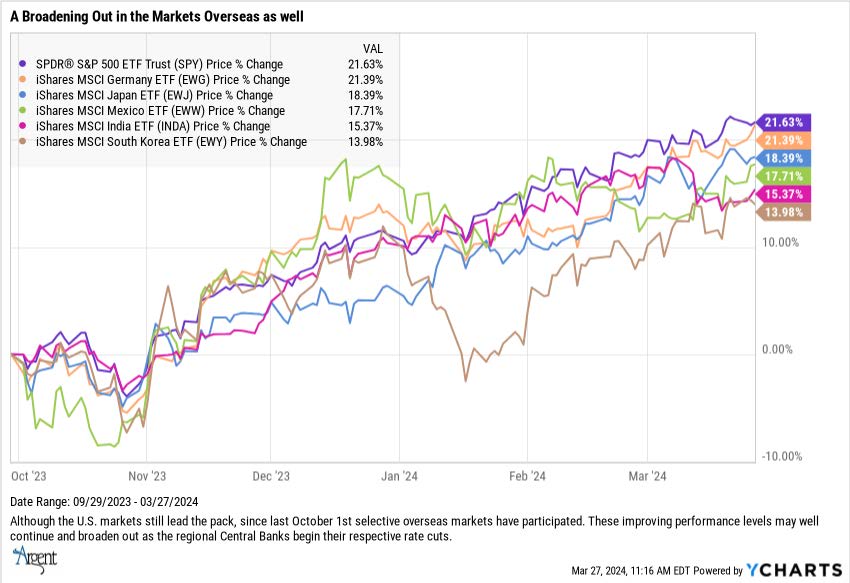
- The impact of central banks’ policy shifts should not be underestimated. Historically, it has been a good time to be in the stock market when the Fed has finished hiking rates.. This also holds true for the overseas central banks as those expectations of policy shifts have likely contributed to the rally in a few select overseas markets since last October.
- The Swiss National Bank was the first major central bank to ease its monetary policy, and expectations are that this action will be followed over the next few months by both the Bank of England and the U.S. Federal Reserve. Smaller national banks that have already reversed their tight monetary policies include Brazil, Mexico and Hungary. The global markets might become more interesting sooner than many expect.
Not Investment Advice or an Offer -This information is intended to assist investors. The information does not constitute investment advice or an offer to invest or to provide management services. It is not our intention to state, indicate, or imply in any manner that current or past results are indicative of future results or expectations. As with all investments, there are associated risks and you could lose money investing.